Have you ever wanted to track local weather conditions without leaving your favorite spreadsheet tool? Or do you need to keep track of the weather in different locations without constantly checking multiple websites? With a little bit of code, you can create a dynamic weather dashboard that pulls in data from the OpenWeatherMap API and displays it clearly and concisely in Google Sheets. In this article, I will show you how to set up a simple weather dashboard in Google Sheets using the OpenWeatherMap API.
Table of Contents
Video Tutorial
If you’d prefer written instructions with additional tips, just keep reading.
Why might someone want to create a weather dashboard?
Whether you’re planning an outdoor activity or simply need to stay informed about the weather in multiple locations over a longer period, a weather dashboard can be a valuable tool. While weather apps and websites provide convenient solutions for quick forecasts at one or two locations, individual lookups become cumbersome when dealing with numerous sites and extended timeframes.
Creating a weather dashboard simplifies this process by displaying all relevant information in one centralized location, saving you time and effort. This not only helps you plan activities effectively but also provides a comprehensive overview of potential weather impacts, making it a valuable addition to your planning arsenal. Below are some of the key benefits of creating a weather dashboard.
- Instant Access: Get current and future weather conditions for multiple locations instantly, eliminating the need to jump between different forecasts.
- Planning Made Easy: Make informed decisions about your daily activities based on the weather, ensuring you’re prepared for any conditions.
- Boost Your Efficiency: Track weather trends and patterns to identify potential risks or opportunities, especially if you work outdoors or manage weather-sensitive operations.
- Tailored to You: Personalize your dashboard to display specific information relevant to your interests, such as UV index, humidity, or wind speed.
Why Choose Google Sheets to create a weather dashboard?
Google Sheets offers several advantages for creating a weather dashboard:
- Accessibility: Most individuals already have access to Google Sheets through their Google accounts, eliminating the need for additional software.
- Integration of Google Apps Script: Google Apps Script allows you to connect your dashboard with other applications, such as Google Calendar or email, for enhanced functionality and automation.
- Automation: Scripts like the one provided in this post can automate data retrieval and updates, keeping your dashboard current without manual intervention.
- User-friendly: The familiar Google Sheets interface makes it easy to learn and use, even for beginners.
- Customization: Google Sheets offers a wide range of formatting and visualization options to personalize your dashboard.
- Collaboration: Share your dashboard with others and collaborate on its development and customization.
- Cost-effective: Google Sheets is a free service, making it an affordable option for creating a weather dashboard.
Building Your Weather Dashboard: Step-by-Step Guide
Here’s a step-by-step guide to creating your weather dashboard in Google Sheets:
Create an OpenWeatherMap account and API Key
Before embarking on your dashboard construction, you’ll need to acquire an OpenWeatherMap API key. This unique key allows you to interact with the API and unlock its vast data reserves. Head over to OpenWeatherMap’s website and follow the simple registration process to obtain your key.
Once you sign up, click on your name in the top menu bar and select “My API Keys”. Give a name for the API key and click the Generate button. Then you will get your API key. Remember, this key acts like an access code, so keep it safe!
One Call API 3.0
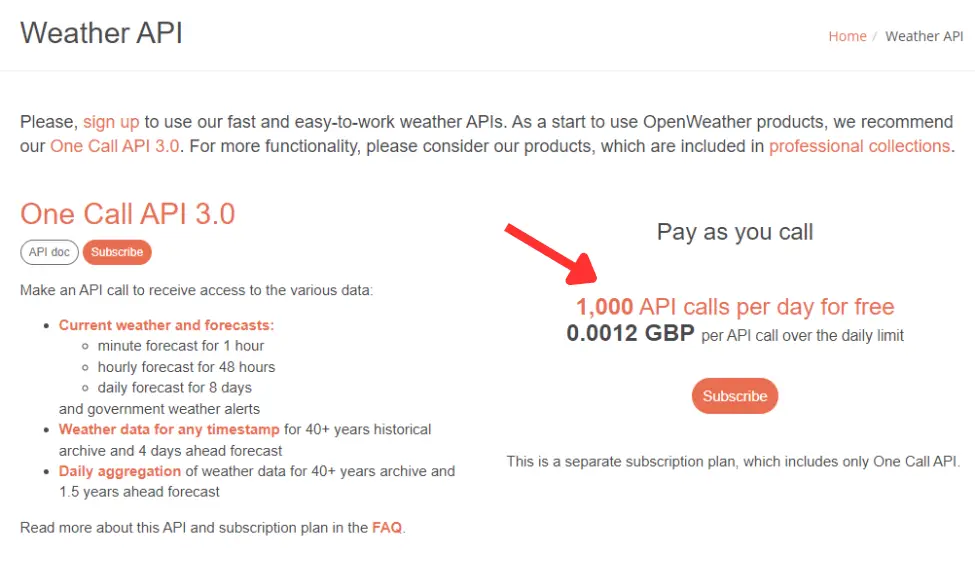
OpenWeatherMap offers both free and paid APIs for accessing different types of weather data. One notable API is the One Call API 3.0, known for its speed and user-friendly interface. To use this API, you’ll be required to enter your payment details, but you won’t incur charges until you surpass 1000 API calls per day. This limit is generally sufficient for personal or small-scale applications. The image below is a screenshot of their website, and you can view it through this link. Click on the subscription button to initiate the subscription process and set up your payment details.

You have the option to restrict the number of API calls per day. By setting this limit to 1000, you can ensure that you won’t incur charges beyond the free limit. However, if you need additional API calls, there’s a charge of 0.12 GBP for every extra 100 API calls.

Create the Google Sheet
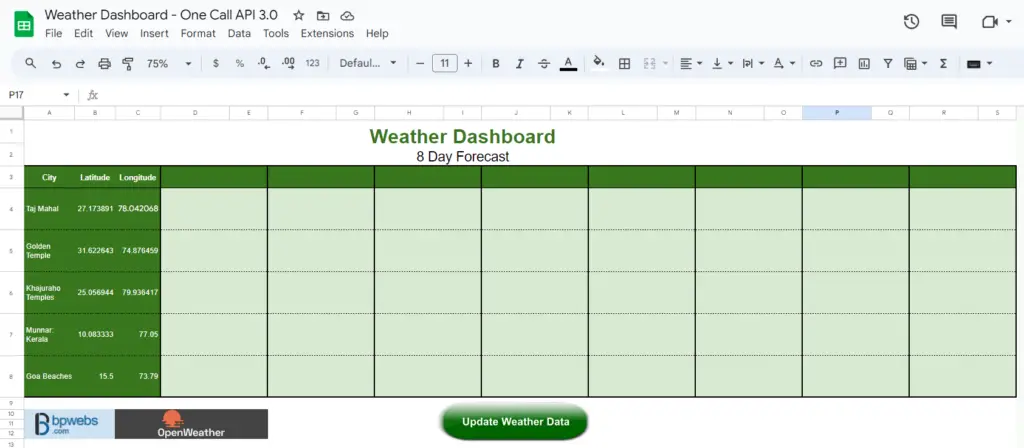
Open a new Google Sheet, create a sheet, and name it “WeatherDB”. We will use this name in the code, and this is the sheet we build our dashboard.
The code explained below expects the latitude and longitude values (explained below) of the location (where the weather data is looked up) to be located in the range B5:C9. To follow along with the code, you may also include the location data in the same range.

Alternatively, you can copy the Google Sheets with the code to your Google Drive from the following link. Then you can start modifying the location list and code.
Adding Locations
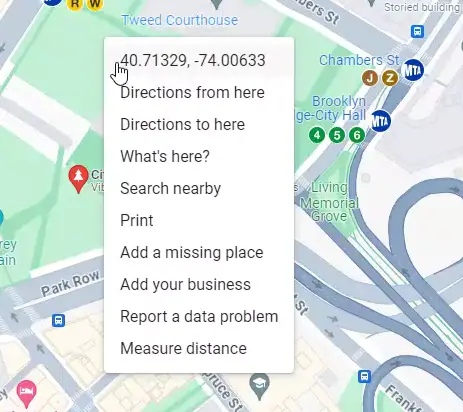
To retrieve weather data from the OpenWeatherMap API, you must provide the location’s latitude and longitude. OpenWeatherMap offers a Geocoding API that allows you to obtain this information. Alternatively, you can obtain the latitude and longitude values from Google Maps.

To do that,
- Search for the location
- Zoom into the location
- Right-click on the exact location and click on the coordinates to copy them to the clipboard
You can paste this value into Google Sheets. The latitude and longitude are separated by a comma “,”. You need to split them into latitude and longitude columns.
The Google Apps Script Code
The Google Sheet linked above contains the Google Apps Script code used to create the Dashboard. You can access the Google Apps Script files by navigating to Extensions > Apps Script.
If you copied the Google Sheet from the link above, you’ll see the following code already in the Script Editor. However, if you start by creating a new Google Sheet in your Google Drive, replace the existing default code with the following.
Understanding the Script for the weather dashboard in Google Sheets
This code automates the retrieval of weather data for your weather dashboard in Google Sheets. It begins by extracting latitude and longitude values from designated cells. Subsequently, it utilizes these coordinates to request the relevant weather data from OpenWeatherMap. Lastly, the script inserts the retrieved weather information, such as temperature and weather and weather icons, back into the designated cells within your sheet.
Here’s a breakdown of the script:
Constants;
Constants are like variables, but their values cannot be changed after being assigned. I’ve separated these constants and placed them at the beginning of the script to facilitate easy modification based on your specific needs.
API_KEY: A unique key for accessing the OpenWeatherMap API. You need to replace the text “YOUR API KEY” with the API key you generated from OpenWeatherMap.SHEET_NAME: The name of the Google Sheet where the weather data will be updated. In the provided code, it’s set as “WeatherDB”.EXCLUDE_PARTS: Parts of the weather data to exclude from the API response. In this example, we use only daily weather forecasts. So, we have excluded the current, minutely, hourly, and alerts parts from the response.REQUEST_URL: This is the base URL used to send requests to the OpenWeatherMap API. The additional parameters, such as latitude-longitude, unit, and API key, are appended to this URL for each individual request.ICON_URL: This serves as the base URL for retrieving weather icons. To create the specific weather icon URL, the corresponding weather icon number from the weather data is appended to this base URL.LOCATION_RANGE: The range in the spreadsheet containing latitude and longitude values for different locations.HEADER_RANGE_START: The starting range of the header row in the Google Sheet.DATA_RANGE_START: The starting cell for inserting weather data in the Google Sheet.
Main Function getWeatherFromOpenWeatherMap():
This is the main function that we directly execute to update the weather dashboard in Google Sheets. It utilizes the other functions during its execution to fetch weather data and update the Google Sheets, creating a dynamic weather dashboard.
- First, it gets the list of location to locations variable from the Google Sheet.
- Then, Iterates through the locations.
- Builds an API request for each location using
buildApiRequest()function. - Fetches weather data from OpenWeatherMap using
fetchWeatherData()function. - Parses the JSON response with
parseResponse()function. - Updates the sheet with temperature, weather descriptions, and weather icons for the 8-day forecast.
- The
firstIterationvariable: Initially set to true, it ensures that the header row is created only once. After the first iteration, it is set to false.
Helper Functions:
buildApiRequest(lat, lon): Constructs the API request URL based on latitude and longitude.fetchWeatherData(request): Fetches weather data from OpenWeatherMap using the provided API request.parseResponse(response): Parses the JSON response from the OpenWeatherMap API.
How to run the Script
As mentioned above, you need to run the getWeatherFromOpenWeatherMap() function to get the weather data to update the weather dashboard in Google Sheets. To do that, select that function from the top toolbar of the Google Apps Script editor. Then click the run button.
You’ll be prompted to grant permissions when you run the script for the first time. To do this, click Continue, select your email, click Advanced click the name with Apps Script name, and click Allow on the next screen.
Create a button to run the script
You can add a button to your Google Sheet to execute the script, allowing you to update the weather data without having to open the Apps Script file.
You can learn more about it from the blog post, How to Create a Button in Google Sheets to Run Scripts.
Schedule the script to run automatically
You can also configure the script to automatically update your Weather Dashboard in Google Sheets at specific time intervals.
- Navigate to Triggers (the clock icon) in the left menu of the Apps Script editor.
- Click the “Add Trigger” button at the bottom right corner.
- Ensure that the “
getWeatherFromOpenWeatherMap()” function is chosen in the “Choose which function to run” dropdown. - Choose “Time-driven” from the “Select event source” dropdown list.
- Select the type of time-based trigger (Minutes timer, Hour timer, Day timer, etc.).
- Set a time interval based on the selected trigger type.
- Click Save.
This configuration will automatically update the Weather Dashboard at the specified time intervals.
Receive weather updates as an HTML table in your email
You can also automate this script to receive weather updates to your inbox at your preferred intervals. You can follow the example described in this article to do that.
Create a weather dashboard as a web app
When you create a weather dashboard in Google Sheets, it retains the appearance of a spreadsheet. If the spreadsheet style doesn’t suit your preferences, you have the option to utilize Google Apps Script to develop a web app for showcasing your weather data. If you’re comfortable with coding, you can explore creating a weather information app by referring to our diverse articles on Google Apps Script for valuable insights.
Wrapping Up
In conclusion, this guide demonstrated the steps to craft a personalized weather dashboard in Google Sheets using the OpenWeatherMap API. Whether you’re planning activities or managing operations affected by weather, this dashboard centralizes information for multiple locations. The article highlighted the advantages, including instant access to weather updates, simplified planning, increased efficiency, and customization options. Google Sheets proves an accessible, user-friendly, and cost-effective platform for this task. Whether you prefer manual updates, a one-click button, or automated scheduling, this weather dashboard empowers you with real-time insights tailored to your needs.


