How to create a Heatmap in Google Sheets

How to create a Heatmap in Google Sheets

Data visualization is a powerful tool for understanding complex information at a glance. Among the various visualization techniques, heatmaps stand out for their ability to represent data through color-coded matrices. In this blog post, we’ll explore how to create an effective heatmap in Google Sheets, a free and accessible tool that’s widely used for data … Read more

Display Google Sheets Data on Interactive HTML Tables (Quick & Easy Setup)

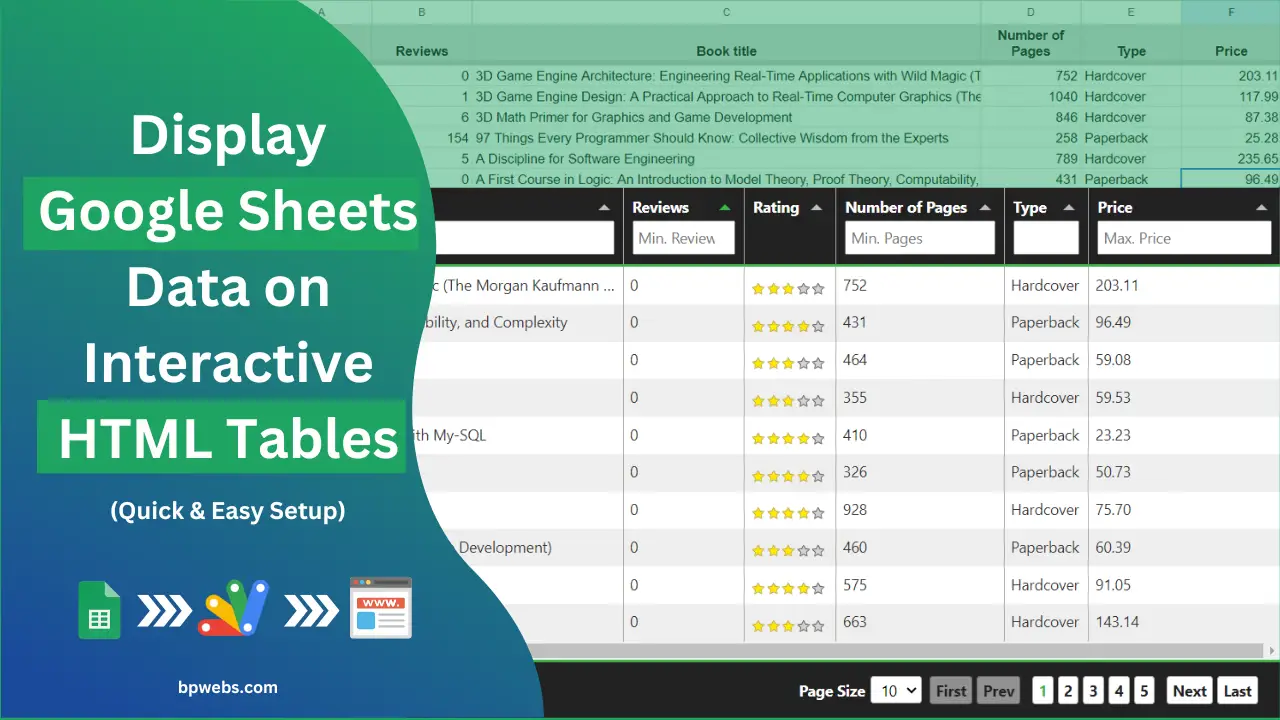
Display Google Sheets Data on Interactive HTML Tables (Quick & Easy Setup)

Have you ever wanted to turn your static Google Sheets data into something more engaging and user-friendly? While Google Sheets is excellent for storing and organizing information, it can be limiting when you need to present your Google Sheets data on interactive HTML tables. Google Sheets’ basic HTML exports are often clunky and lack the … Read more
Visualize Google Sheets Data in HTML Charts

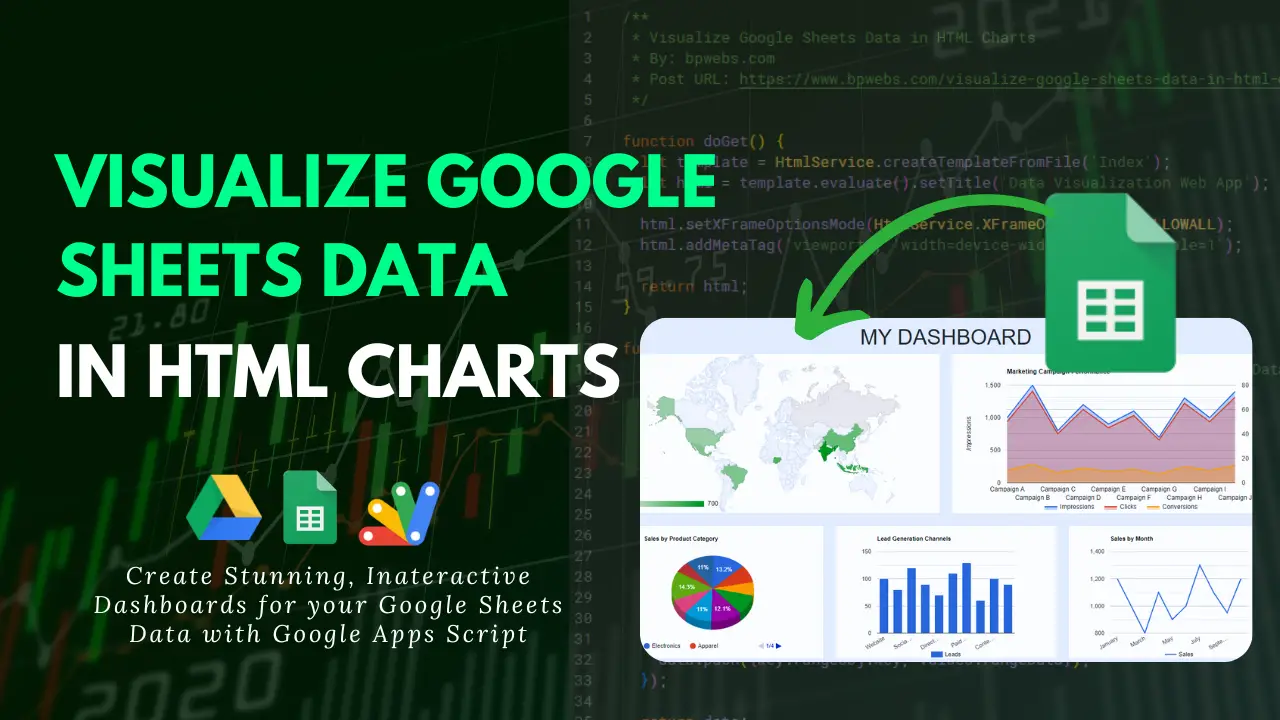
Visualize Google Sheets Data in HTML Charts

When it comes to managing and analyzing data, Google Sheets is a reliable tool. However, to truly harness the insights within your data, you need visually engaging and interactive charts. That’s where the combination of Google Apps Script and Google Charts comes in. In this blog post, we will explore the benefits of visualizing Google … Read more

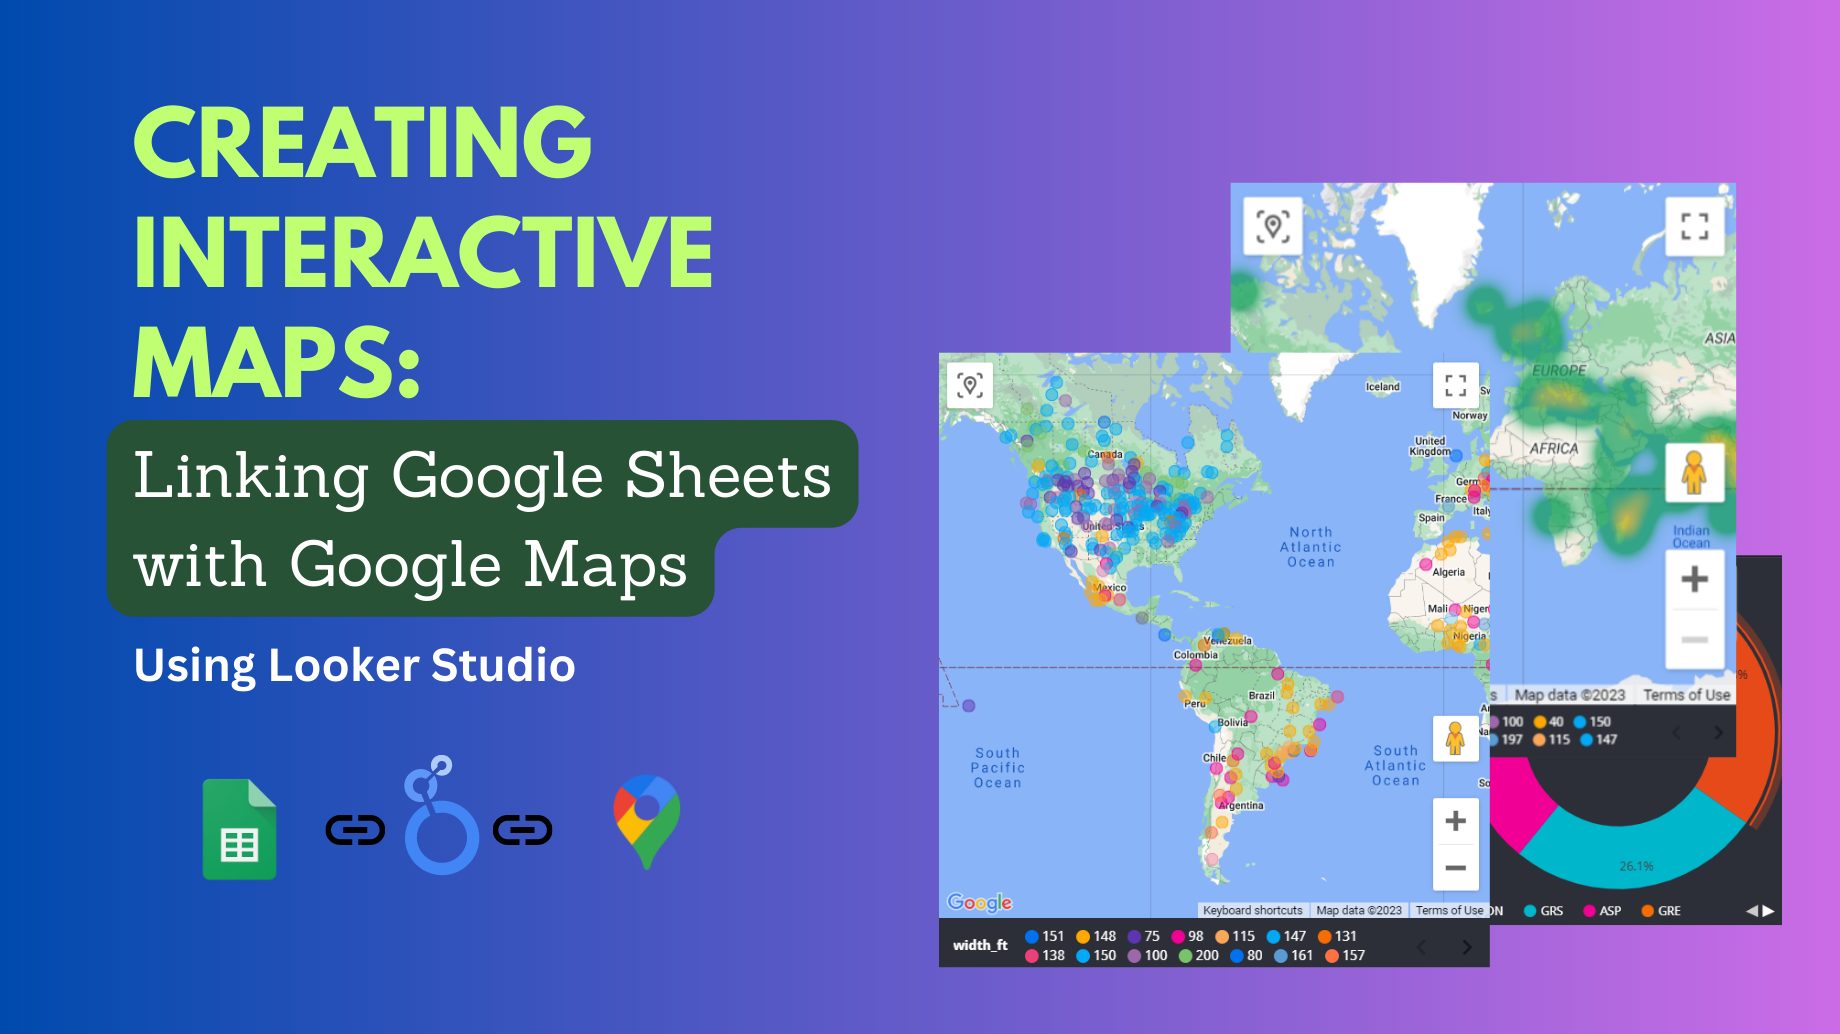
How to link Google Sheets to Google Maps and create interactive maps

How to link Google Sheets to Google Maps and create interactive maps

Most of our day-to-day databases include geographic data such as country, region, city, address, latitude-Longitude, place names, etc. Many of you are used to storing these data on spreadsheets applications like Google Sheets, Microsoft Excel, etc… If you can link these databases to a map, you can see the changes to your data in real-time … Read more

Create Stunning Free Online Dashboard for your Data

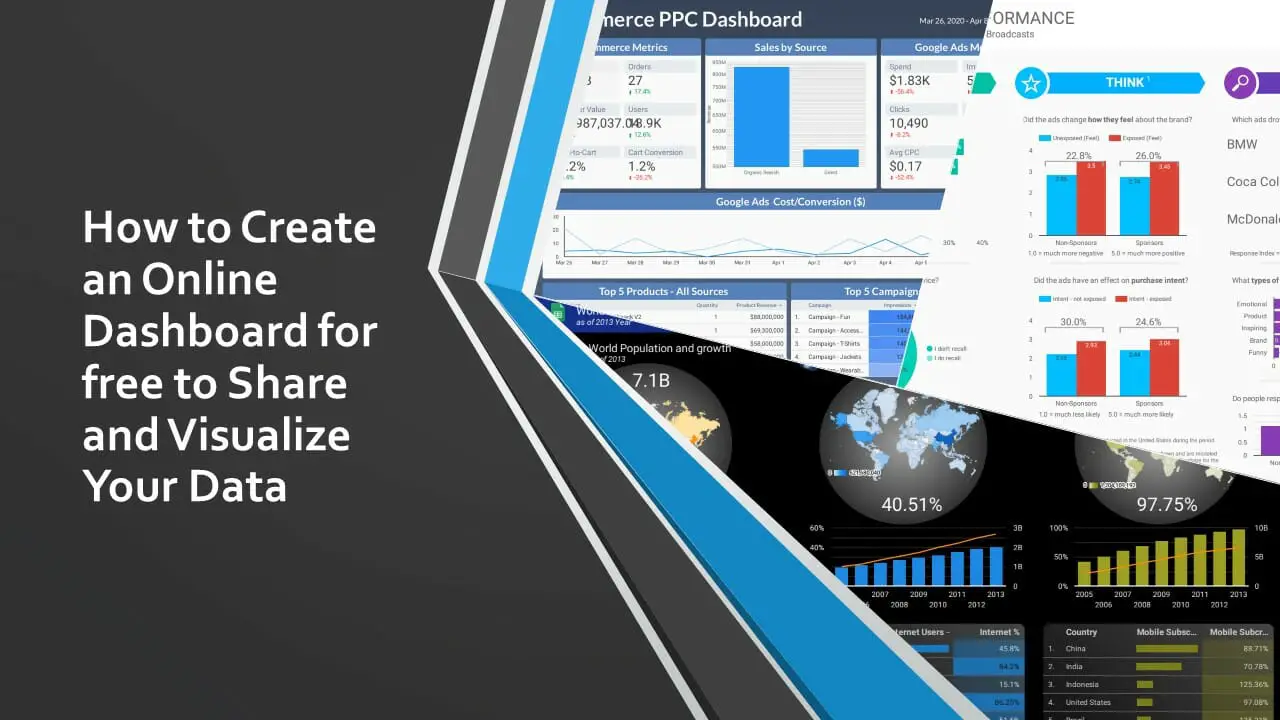
How to Create an Online Dashboard for free to Share and Visualize Your Data

When you are working with databases, you know there are thousands or millions of records in a spreadsheet or your database. These data don’t sense anything when it is in that format. However, if you can represent these data in a graphical form, it is easier to visualize and understand trends, outliers, and patterns in … Read more