Have you ever wanted to turn your static Google Sheets data into something more engaging and user-friendly? While Google Sheets is excellent for storing and organizing information, it can be limiting when you need to present your Google Sheets data on interactive HTML tables.
Google Sheets’ basic HTML exports are often clunky and lack the interactivity users crave. That’s where interactive HTML tables come in! With the power of Google Apps Script and the Tabulator library, you can quickly transform your spreadsheet data into tables that users can filter, sort, search, and interact with. And the best part? It’s surprisingly easy to set up.
In this tutorial, I’ll walk you through the process step-by-step.
In a previous post, we discussed ‘How to Pull Data from Google Sheets into an HTML Table‘. We used the Datatables library for that method. Depending on your specific requirements, you can choose either approach for creating interactive tables.
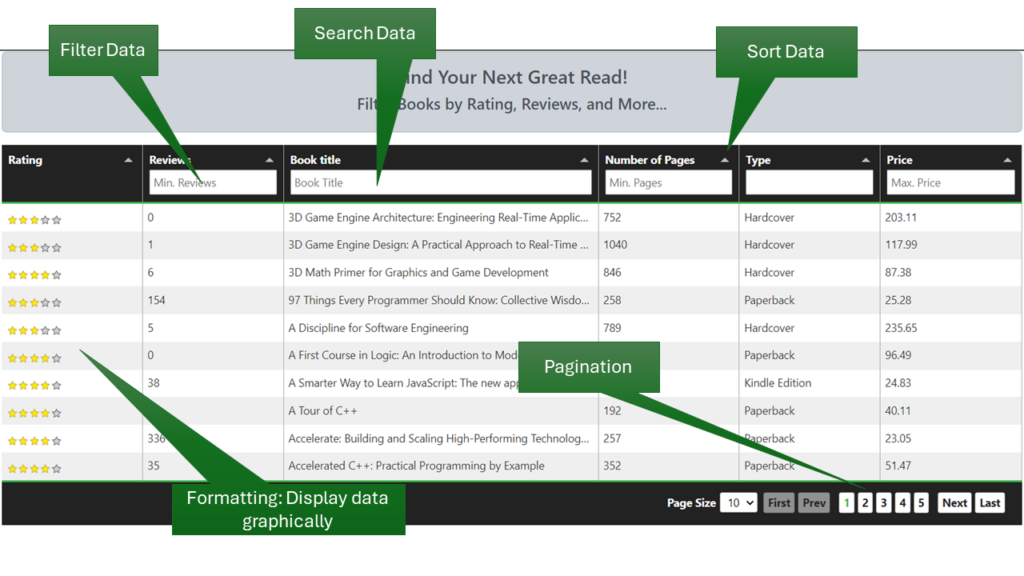
For better understanding, here is a screenshot of the HTML table we will construct in this blog post.

Table of Contents
Video Tutorial
If you’d prefer written instructions with additional tips, just keep reading.
The Concept
Generally, making an online HTML page means building a website, which usually needs technical know-how and may involve some costs for resources. However, none of these are necessary here. You can create a web app for free and share its unique URL with anyone on the internet for free.
With a few free tools from Google, you can transform your spreadsheet data into an interactive web app. Here’s how the pieces fit together:
- Google Sheets: Stores your data in an organized way.
- Google Apps Script: Fetches your data and prepares it for the web app.
- HTML, Bootstrap, and Tabulator:
- HTML: Provides the web app’s basic structure.
- Bootstrap: Makes it look good on any device.
- Tabulator: Turns your data into a powerful, interactive table.
Ready to display your Google Sheets data on interactive HTML tables (in a Web App), It’s simpler than you might imagine!
No Coding Experience? No Problem!
Don’t worry if you’re new to coding! I’ll provide the necessary code for Google Apps Script and Tabulator. You’ll primarily focus on customizing the code to match your own spreadsheet data.
Step-by-step guide to Display Google Sheets Data on Interactive HTML Tables
For a smooth learning experience, I’ll guide you through the process step-by-step. To get started, I recommend using my provided Google Sheets and Apps Script file (link below) as a template. This allows you to see how the solution works before diving into your own data. Once you understand the basics, you can replace the sample data in the spreadsheet with your own and adjust the column names in the code to match your headers.
Step 01: Copy the Google Sheets and Google Apps Script file to your Google Drive
There are two main ways to use Google Apps Script with Google Sheets:
- Bound Script: This type of script is directly attached to your Google Sheet. When you share the spreadsheet, the script automatically goes with it.
- Unbound Script: This type of script exists separately from any specific spreadsheet. It’s more flexible and has to be shared independently.
In this tutorial, I’ve used an unbound script. This means you’ll need to copy both my Google Spreadsheet and Apps Script code separately (using the links provided above).
Step 02: Update the Spreadsheet ID in the Code
To connect your Google Sheets data to the Google Apps Script code, you’ll need to update the Spreadsheet ID. Here’s why:
- Unique IDs: Every Google Sheet has a unique identifier. The provided code initially points to the spreadsheet in my Google Drive.
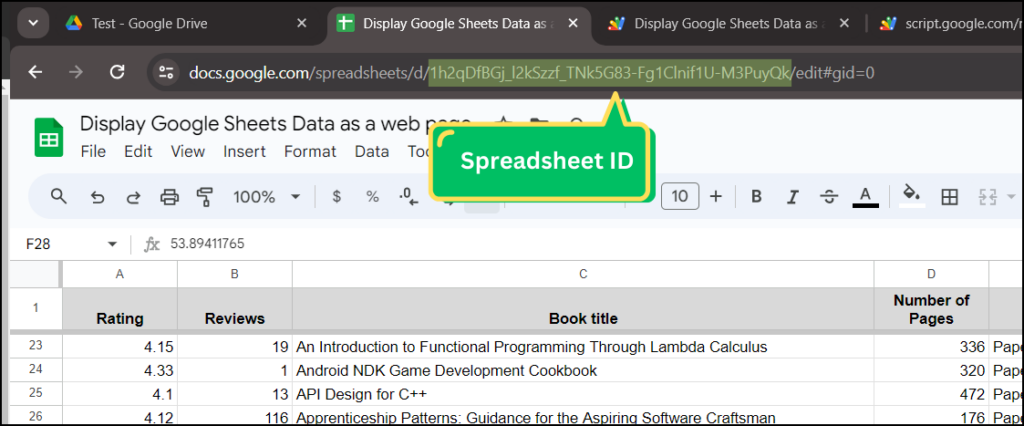
- Making it Yours: When you copy the Google Sheet, it gets a new ID. You’ll need to replace the existing Spreadsheet ID (the “SPREADSHEET_ID” in line 8 of the Code.gs file) with the ID of the copied spreadsheet in your Drive.
Finding Your Spreadsheet ID: The ID is part of the long URL of your spreadsheet, as shown in the image below.

Step 03: Deploying & Getting the Web App URL
You should deploy the code as a web app to make your interactive table visible online. Here’s how:
- In the Apps Script Editor, go to Deploy > New Deployment.
- Select Type “Web App”
- Configuration:
- Description: Add a brief description of your web app (optional).
- Execute as: Choose “Me” (your email address).
- Who has access: Select “Anyone” to make the table viewable to anyone with the URL without requiring a Google login.
- Click Deploy. (When you run the script for the first time, you will be prompted to grant permissions. To do so, please click on ‘Authorize Access’, select your email, click on ‘Advanced’, click on the link with the ‘Apps Script’ name, and then click ‘Allow’ on the next screen.)
- Copy the web app URL.
- View Your Table: Paste the copied URL into your web browser’s address bar and press Enter. Your interactive table should load!
Live Demo
You can access the live demo of the web app by clicking on the link below.
Customize the Web App to Use with Your Data
If you have successfully generated the web app as explained above, it’s time to customize it to display your data.
Let’s explore how we can achieve it.
Setting up the Google Sheets
To ensure your interactive table works seamlessly, let’s start by organizing your Google Sheets data. A well-structured spreadsheet makes it much easier to fetch and display your data correctly. Here are the key points:
- Clear Headers: Your first row should contain descriptive names for each column (e.g. Rating, Title, Price, etc…)
- No Merged Cells: Avoid merging cells within your main data area. Merged cells can cause issues when fetching the data.
- Consistent Data: Ensure each column has a consistent data type. For example, if a column is for prices, all entries should be numbers.
Why does this matter? A well-structured spreadsheet helps ensure your web app accurately represents your data, making it easy for users to sort, filter, and understand the information in your interactive table.
The image below shows the data table we used to generate the HTML table.

The Code
Let’s see how to modify the code to display your Google Sheets data on interactive HTML tables. The code you saw in the Google Apps Script project above is provided below.
Instead of explaining each line of code, I’ll describe the key functions and where to update the code to display your Google Sheets data on interactive HTML tables.
Code.gs
This file handles fetching data from your spreadsheet, transforming it into the right format, and communicating with the HTML files.
At the top of the code, you can see two constants, SPREADSHEET_ID and DATA_RANGE. You need to update these two constants according to your Google Sheets. Update the SPREADSHEET_ID as explained above.
For the DATA_RANGE, defines the range of cells containing data (Sheet name and cell range). Adjust if your data is in a different location (e.g. “Data!A1:F”).
The doGet() function is the heart of your Apps Script. This runs when someone accesses your web app. It creates an HTML output using your ‘Index’ template file. Adds a meta tag for better display on mobile devices.
The getData() function retrieves your data from the Google Sheet. Converts the data into an array of objects, which Tabulator easily understands.
The include() function is a helper function to include the contents of other HTML files, keeping your code organized.
Css.html
Includes links to Bootstrap’s CSS for styling and Tabulator’s CSS for table appearance. Your custom CSS should also be included here.
Index.html
This contains the main HTML structure. It uses “<?!= include('...') ?>” tags to dynamically insert content from your other HTML files. This file contains the DIV element that contains the id=example-table where your tabulator table will be placed.
The page title that appears at the top of the browser window/tab can be changed in this file.
JavaScript.html
This file contains the JavaScript code that handles the creation and configuration of Tabulator tables. Tabulator offers a variety of features and functionalities to enhance the style and organization of your data tables. For more information, please refer to their documentation available at the following link.
In this file, the createTable() function fetches data using google.script.run (from your Apps Script) and initialize the Tabulator table.
Inside the createTable() function, you’ll find the “columns” property. This is where you customize the appearance and behavior of your table’s columns. To match your Google Sheets data, define each column within this property using curly brackets, like this:
{title:"Type",field:"Type",},//Here, the second "Type" is the column header eactly as in the Google SheetHere’s a breakdown:
- title: This is the text displayed in the column header.
- field: This must match the corresponding header name in your Google Sheets data.
Customize each column object with options for width, filters, formatting, and more. Tabulator offers extensive customization possibilities!”
For example,
- I have added
headerFilter:trueoption to include a search box just below the column header. - The
headerFilterFunc:lessThanFilterin the price column calls the custom functionlessThanFilter(headerValue, rowValue)when the user types some value in the search box of the price column.
The Tabulator library offers a wide range of features, giving you the power to build highly interactive HTML tables from your Google Sheets data. To explore advanced customizations, refer to the Tabulator documentation (link provided above). Additionally, AI tools like Gemini or ChatGPT can help you generate code snippets and suggest different customization options.
Important !: If you start with a new Google Apps Script project (instead of making a copy of the Apps Script project given above), you need to enable Google Sheets API Service for your project.
To do that, click the + icon in the Services tab, select Google Sheets API, and click Add.
Wrapping Up
This blog post demonstrates how to effortlessly transform your Google Sheets data into dynamic, interactive HTML tables. Using the power of Google Apps Script and the Tabulator library, this process is surprisingly straightforward. The key steps involve organizing your spreadsheet with clear headers and consistent formatting, using the provided code snippets as a base, and customizing them to match your spreadsheet’s columns.
Tabulator provides a wide array of features for filtering, sorting, and more, giving you the ability to create an interactive HTML interface for your Google Sheets data. You can effortlessly enable or disable most of these features without much coding knowledge. If you are searching for an easy setup to display your Google Sheets data on interactive HTML tables, then this is an excellent solution for you.


wow! nice
How to add a filter to a column, where value is formatted as Date (e.g. 12/14/2024), to select a date range “from – to”?
Thank you, this is just super good!
Is there a way to display 20 instead of 10 that seems to be default?
application are working properly great ⭐i m deployment new purchase order application {“https://script.google.com/a/macros/colorplast.in/s/AKfycbyMxntSXdZT5Hi1W_G8cmQLOFRNSBlaJP5PpEutIUNvd4xfllPrXskO8NU-prko9-OE/exec”} with login popup [email protected]
Is there a way to get the table from Google Sheet to a basic table in html as well? So not using datatable or any other complex table. Also when I include in an iframe to my site, it wraps a lot of stuff around it so I can “not access” the table with jQuery function. Solution? Thanks in advance.
Hello. please tell me I added a few more columns, the headers are shown but the data is not displayed in them. What could be the problem? thank you in advance
Really, thank you for clarification. I was searching about it but you are the best instructor.
Best regards.
Senior Typist
how do I add a link button inside the column?
how to do Display URLs as hyperlinks?
Add
formatter:"link"to the relevent column in the createTable function of the JavaScript.html file.E.g.
{title:"Type",field:"Type",headerFilter:true, formatter:"link"},