A progress bar is a graphical representation used to visually indicate the status or progress of a task, process, or operation. Google Sheets is a very useful tool to measure progress because it is free and you can easily share it with your team members and work on multiple device types. In this post, I will show you how you can create progress bars in Google Sheets to visualize your progress.
Table of Contents
Introduction
In this post, I will explain how to create two types of progress bars. First, I’ll show you how to make a progress bar to visualize the completion percentage of individual tasks. Then, I’ll demonstrate how to create a progress bar to visualize the overall progress of a checklist based on checkbox status.
You can enhance the visibility of these progress bars by adding colors to represent different stages of progress. This article will also guide you on adding multiple colors to progress bars in Google Sheets.
Video Tutorial
If you’d prefer written instructions with additional tips, just keep reading.
Visualizing Task Progress: Adding Progress Bars in Google Sheets for Individual Task Completion
By adding a progress bar to each of your individual tasks, you can easily see which tasks are completed, which ones are still in progress, and how much of each task is already done. This can be very helpful in understanding the project’s status without the need to read numbers.
If you’re using Google Sheets to plan your project, you can easily incorporate progress bars for each task to visually track their progress using the SPARKLINE function.
The following is the basic use of the SPARKLINE function to create a progress bar.
=SPARKLINE(50%,{"charttype", "bar"; "max", 100%}) -----[1]If you copy and paste this function into a cell, you will see a progress bar that fills 50% of the length of your cell. By providing a reference to the cell that contains your task’s progress percentage as the first parameter (instead of the value 50% in the above equation), you can get a dynamic progress bar that updates when you change the progress.
You can also change the color of the progress bar. You can rewrite the function by including cell reference and color as below.
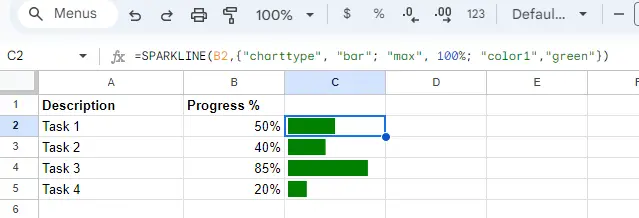
=SPARKLINE(B2,{"charttype", "bar"; "max", 100%; "color1","green"}) -----[2]You can use this formula for all of your tasks to show their progress in a progress bar like in the image below.
Get a Visual Overview of Your Tasks Progress with an Overall Progress Bar in Google Sheets
To get an overview of your entire task list or project, you need an overall progress bar. Creating this progress bar involves calculating the overall progress as a percentage. This can be done by taking a simple average of all tasks or by using a weighted average. Creating the overall progress bar is independent of calculating the progress percentage. For this example, let’s use the simple average to calculate the overall progress. You can create the overall progress bar using the following formula.
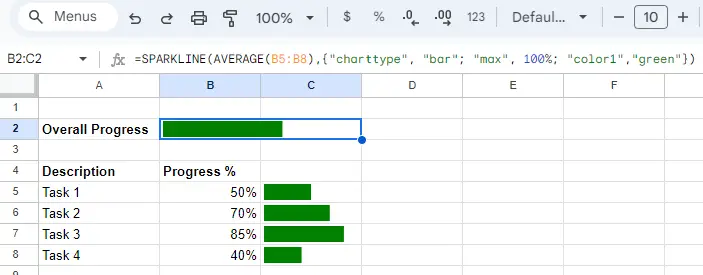
=SPARKLINE(AVERAGE(B5:B8),{"charttype", "bar"; "max", 100%; "color1","green"}) -----[3]In the above formula, AVERAGE(B5:B8) is the average of individual task progress. Here you can use your own calculation to correctly represent the overall progress of your project.
You can increase the length of the progress bar by merging it with the adjacent cells. The following image shows how you can use the above formula to create an overall progress bar for your tasks in Google Sheets.
Add Overall Progress Bar to Checklist in Google Sheets
By adding a progress bar to your checklist, you can clearly visualize how much of your checklist is completed. You can set the progress bar to be updated automatically when you check or uncheck the checkboxes.
To do this first you need to calculate the ratio of completed tasks to all tasks in the list as a percentage. You can do that using the following formula.
=COUNTIF(A4:A13,TRUE)/COUNTA(A4:A13) -----[4]In the above equation, the range A2:A11 is the range where our checkboxes are located.
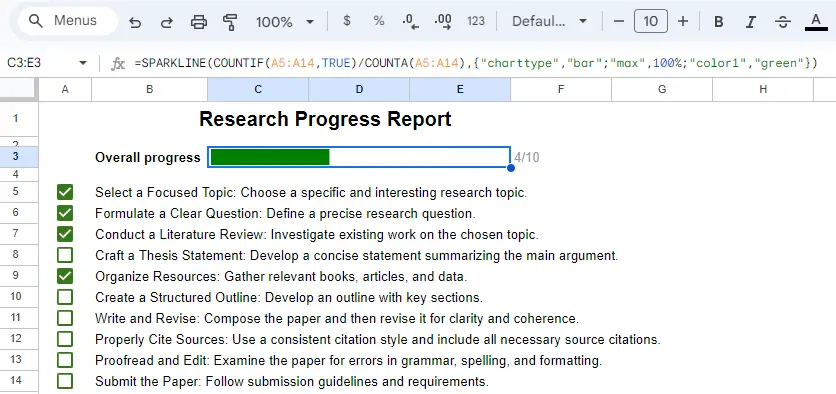
You can provide this function as the first argument of the SPARKLINE function and modify it as shown below to show the progress of the checklist.
=SPARKLINE(COUNTIF(A4:A13,TRUE)/COUNTA(A4:A13),{"charttype","bar";"max",100%;"color1","green"}) -----[5]The image below illustrates how to use the aforementioned function to display your checklist’s progress on the Google Sheets progress bar.
You may also read;
Google Sheets Checkbox: How to Make Your Sheets More Interactive
Add Colors to Google Sheets Progress Bars based on the Progress Levels
You can further improve the visibility of the progress by adding different colors to each progress level. By associating different colors with different progress levels, users can easily see how far along a task is without having to read any text. This can be especially helpful for tasks that take a long time to complete or for tasks that are complex and have multiple steps.
Replace the color name (“green”) in the SPARKLINE function with the following to apply multiple colors to the progress bar based on the percentage completed.
IF(B2=100%,"blue",IF(B2>60%,"green",IF(B2>30%,"orange","gray")))Accordingly, you can modify the formula [2] mentioned above as below.
=SPARKLINE(B2,{"charttype", "bar"; "max", 100%; "color1",IF(B2=100%,"blue",IF(B2>60%,"green",IF(B2>30%,"orange","gray")))}) The screenshot below shows how it looks in Google Sheets.
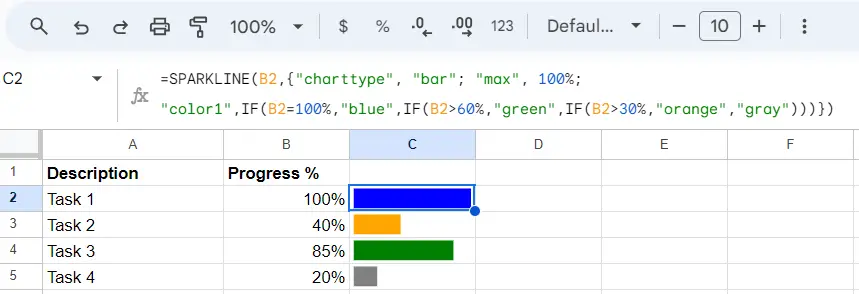
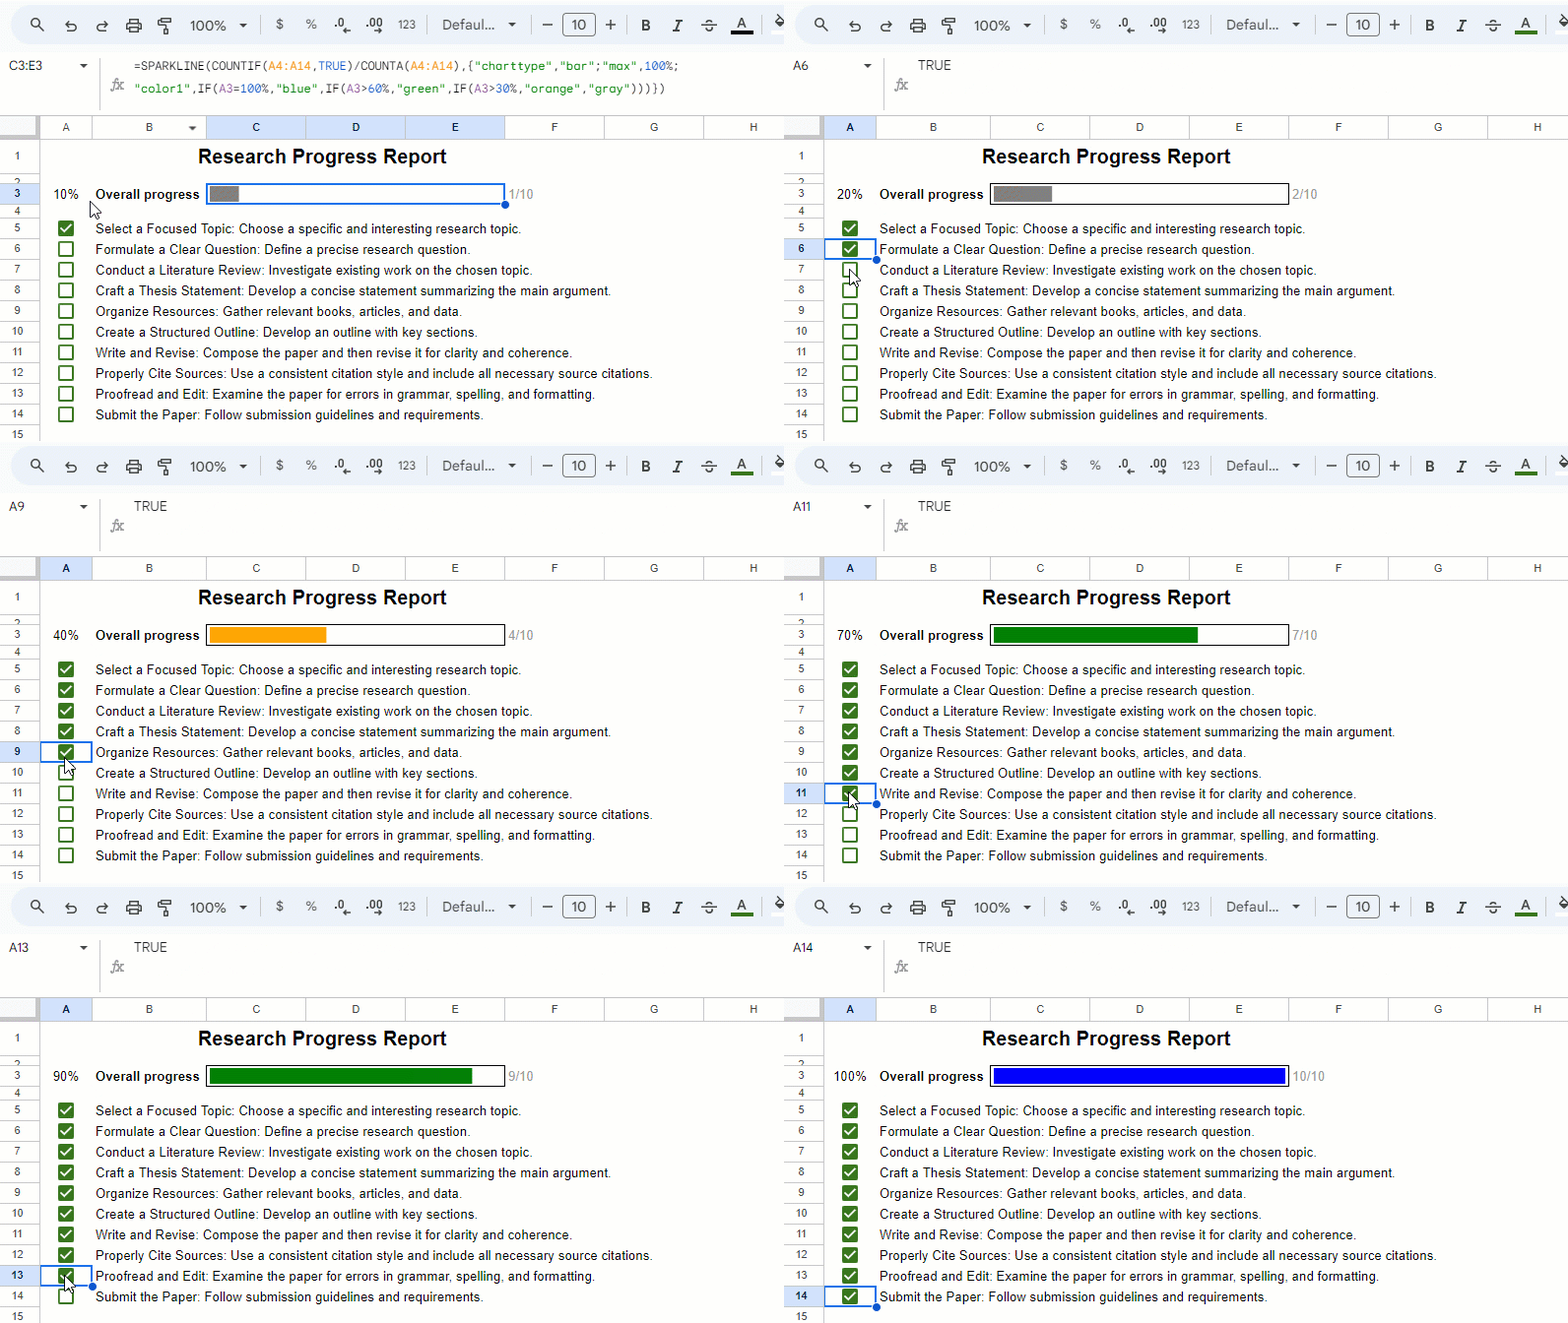
Similarly, you can modify the other functions as well. However, when applying this to the overall progress bar, the formula becomes more complex due to multiple calculations. To avoid this, you can calculate the overall progress percentage in a different cell and refer to that cell when needed.
The following animations show how it works when applied to the checklist example above.
Wrapping Up
Progress bars are a great way to visually represent the progress of your tasks, list of tasks, or a checklist. When you are working with Google Sheets, you can easily add progress bars to show the progress. In this post, we discussed how to add progress bars to individual tasks and overall progress bars to a list of tasks and checklists in Google Sheets. In addition to that, I showed you how you can add multiple colors to each progress level to improve visibility.
I hope this blog post has been helpful. If you have any questions, please feel free to leave a comment below.
