Google Sheets is a powerful tool for managing and analyzing data, but its utility extends far beyond just spreadsheets. Imagine using Google Sheets to store data that needs frequent updates and linking this data directly to your website for visitors to see. With this approach, you can easily update information in Google Sheets, and it will automatically refresh on your website. In this post, I will show you how to display Google Sheets data on a website. To achieve this, we will be using Google Apps Script and the jQuery DataTables plugin.
Table of Contents
Video Tutorial
If you’d prefer written instructions with additional tips, just keep reading.
Why Use Google Sheets for Your Website?
- Easy to update: Anyone familiar with spreadsheets can manage your data.
- Real-time changes: Updates in your sheet reflect immediately on the website.
- Cost-effective: It’s free to use with your Google account.
- Flexible: Works for various data types, from simple lists to complex tables.
The Process at a Glance
- Prepare your Google Sheets data.
- Create a Google Apps Script to publish your Google Ssheet data as JSON.
- Display Google Sheets Data on a website using the generated JSON URL and DataTables JQuery Plugin.
Working Example
To showcase the power of this integration, we’ve created a dynamic pizza price list. The data for this list is stored in a Google Sheet, and the table is updated in real time as changes are made to the sheet. This provides a convenient and efficient way to manage and display pricing information on your website.
Pizza Price List
| Pizza Name | Type | Size | Price |
|---|
Preparing Google Sheets Data
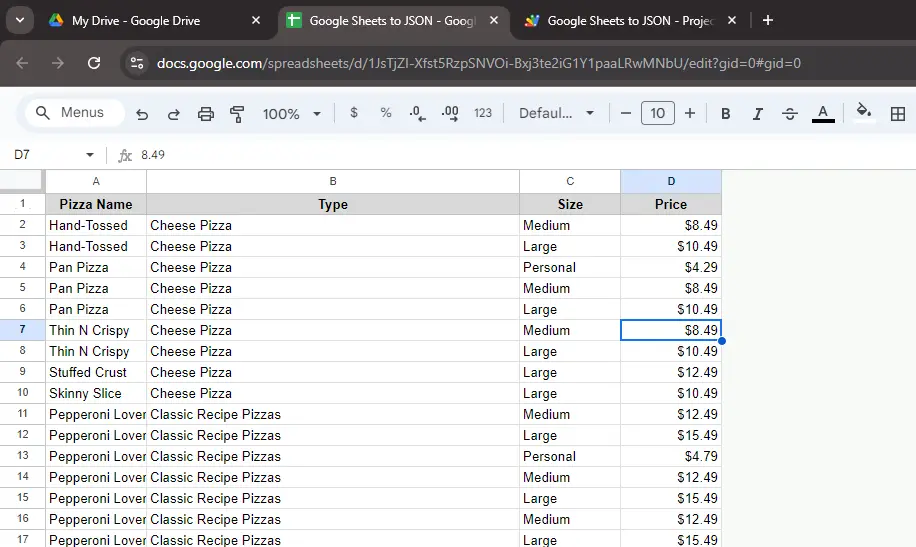
To ensure your Google Sheets data is compatible with the JavaScript code and DataTables plugin, you need to structure it correctly. Here are some key points to consider:
- Header Row: The first row of your sheet should contain the column headers. These headers will be used as column names in your DataTable.
- Data Rows: Subsequent rows should contain the actual data for each row. Ensure that each cell in a row corresponds to the appropriate column header.
- Data Types: While DataTables can handle various data types, it’s generally recommended to use consistent data types within each column.
- Avoid Merged Cells: Merged cells can cause issues when converting data to JSON. Try to keep your data in a simple, unmerged format.
The following image shows a part of the data table we are using in this example.

Export data as JSON using Google Apps Script
Google Apps Script is a JavaScript-based scripting language that allows you to extend and automate Google Workspace applications, including Google Sheets. In this context, we’re using it to create a web service that publishes your Google Sheets data as JSON (JavaScript Object Notation), a lightweight data-interchange format.
- Open your Google Sheet.
- Click Extensions > Apps Script in your Google Sheets Menu to get started.
- Replace any existing code with the following script.
- Save the project with a name like “Sheet to JSON”.
You can download the Google Sheets workbook with the above data and the script from the following link.
Now you need to deploy the above script as a web app to get the JSON URL to display Google Sheets on a website. To do that,
- Click on “Deploy” > “New deployment“.
- Select “Web app” as the type.
- Set “Execute as” to your account and “Who has access” to “Anyone“.
- Click “Deploy” and authorize the app when prompted.
- Copy the provided Web app URL. This is your JSON endpoint.
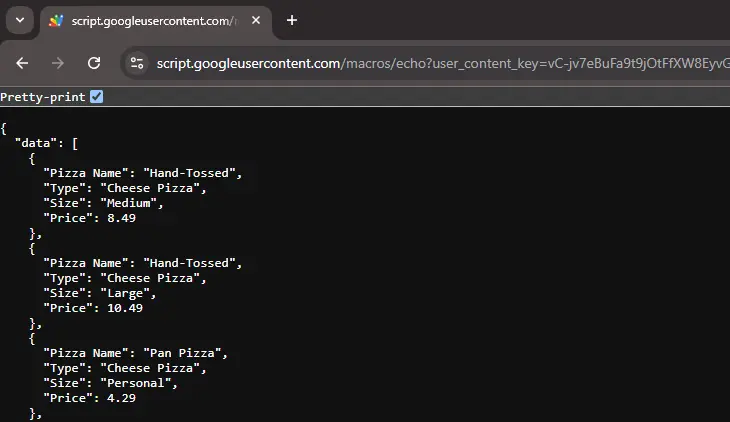
You can test this URL by pasting it into your browser’s address bar. You will see a result similar to the following image.

You can access the JSON data used in the above example on your browser using the following link.
Explaining the code
- This script defines a function called doGet(), which is a special function in Google Apps Script that responds to HTTP GET requests.
- Accessing Sheet Data: The script accesses the active spreadsheet and the sheet (tab) named “Sheet1”, then retrieves all the data using getDataRange().getValues(). This gives us a two-dimensional array of all cell values.
- Structuring the Data: The script assumes the first row contains headers. It then loops through the remaining rows, creating objects where the keys are the header names and the values are the cell contents. These objects are collected into an array.
- Creating JSON Output: The structured data is converted to a JSON string using
JSON.stringify(). This JSON string is then wrapped in a ContentService response, which tells Google Apps Script to serve this content as JSON when the script is accessed via a web request.
Display Google Sheets Data on a website using the generated JSON URL and DataTables JQuery Plugin
Now, you are ready to display Google Sheets data on a website. If you have connected your local computer to the Internet, you can test this method locally.
You can easily display these JSON data on your website using the JQuery DataTable plugin.
jQuery DataTables is a powerful plugin that transforms HTML tables into interactive data grids. It excels at converting JSON data into feature-rich tables with minimal code. DataTables can take JSON from our Google Apps Script to display Google Sheets data on a website with sorting, searching, and pagination. This seamless integration allows for easy flow of data from your spreadsheet to an interactive web display, combining the simplicity of updates with a professional presentation.
You can use the following sample code to display Google Sheets data on your website.
To test the code,
- Create a new HTML file: Open a text editor like Notepad or a code editor like Visual Studio Code.
- Copy and paste the HTML code provided in the previous section.
- Save the file: Save the file as “index.html” on your computer.
- Open the file: Double-click the “index.html” file to open it in your default web browser.
Explaining the Code
- The above code utilizes the following external libraries: jQuery and DataTables. You need to include these JQuery and DataTables libraries in the same order. If you are already using JQuery on your website, you only need to include the DataTables library.
https://cdn.datatables.net/1.11.5/css/jquery.dataTables.min.csshttps://code.jquery.com/jquery-3.5.1.min.jshttps://cdn.datatables.net/1.11.5/js/jquery.dataTables.min.js- The code section from line 9 to line 19 is a basic HTML table with the ID “example”. The table headings are manually specified within <th> tags. Remember to replace the column headers with your actual column headers from Google Sheets as explained below.
- The code section from line 23 to line 38 handles fetching data from the JSON URL and populating the table.
- You need to replace the placeholder URL in line 26 with the actual JSON URL generated by your Google Apps Script deployment.
- The code section from line 30 includes the column headers of the Google Sheets. Be careful to include the column headers exactly as in the Google Sheets. You need to name the column headers in the above HTML table in the same order.
Wrapping Up
By following these steps, you’ve successfully created a dynamic, interactive table on your website using Google Sheets as a data source. This method allows you to display dynamic, real-time data in a user-friendly format, making it perfect for a variety of real-world applications.


I’ve used the step-by-step and provided files at https://www.bpwebs.com/pull-data-from-google-sheets-to-html-table to share a spreadsheet in the HTML page, but only users who have been given permission to edit the actual spreadsheet can see the content. I’ve publised the spreadsheet to the web, but it still won’t work. (It works as intended for anyone with editing rights). Have I missed a step?